
Inspection of the Scottish Fire and Rescue Service North Service Delivery Area
Related Downloads
Overview of Incident Data in the NSDA
In the year ending 31st March 2024 there were nine fatalities in accidental dwelling fires in the North Service Delivery Area of the Scottish Fire and Rescue Service. This was an increase of three from the previous year.
In the same year there were eighty eight accidental dwelling fire non-fatal casualties. Forty of these were classed as a precautionary check up.
In the year to 31st March 2024 there were eight thousand five hundred and thirty nine fire false alarms, three thousand five hundred and ninty of these were unwanted fire alarm signals which resulted in five thousand nine hundred and twenty eight fire appliance mobilisations.
In the year ending 31st March 2024 there were sixteen thousand nine hundred and seventy nine incidents that fire stations in the North Service Delivery Area attended. This was a decrease of three thousand six hundred and twenty from the previous year.
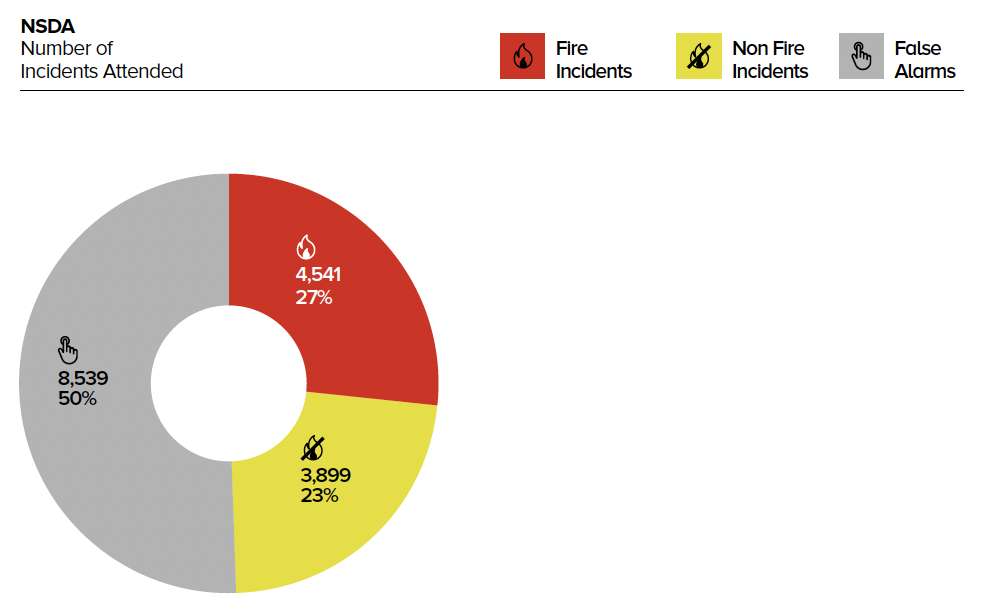
A donut chart showing the number and percentage comparisons between fire incidents 4,541 (27%), non-fire incidents 3,899 (23%) and false alarms 8,539 (50%).
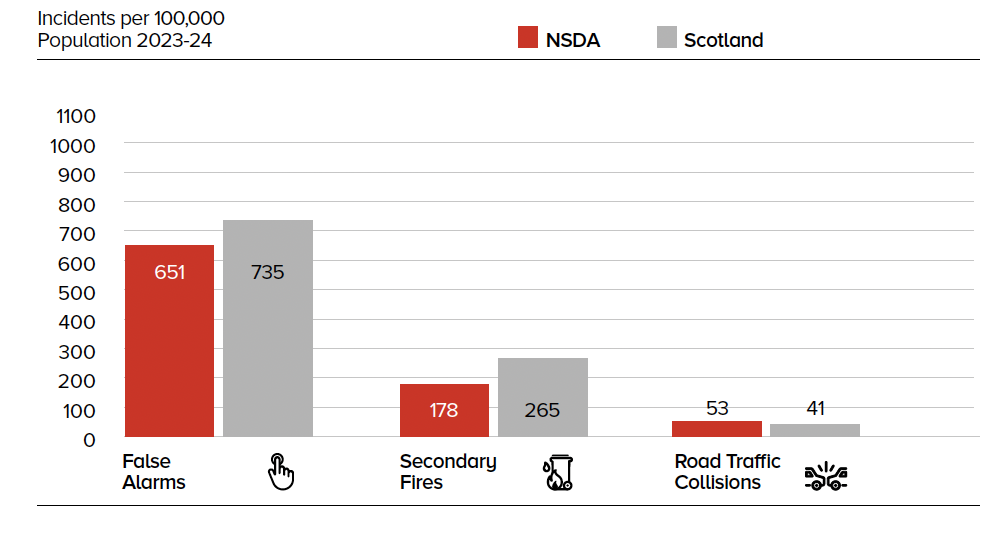
A Bar chart comparing the incidents per 100,000 population for Scotland and the North Service Delivery Area for the year 2023-24. False alarms NSDA 651, Scotland 735. Secondary fires NSDA 178 Scotland 265. Road traffic collisions NSDA 53, Scotland 41.

A Bar chart comparing accidental dwelling fires per 100,000 population for Scotland and the North Service Delivery Area for the year 2023-24. NSDA 142. Scotland 140.
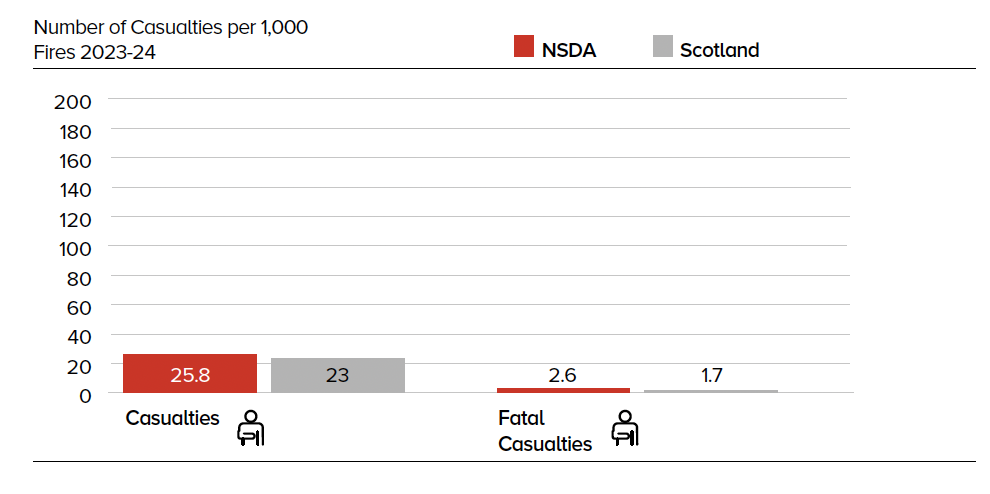 A bar chart comparing the number of casualties per 1,000 population for Scotland and the North Service Delivery Area for the year 2023-24. Casualties NSDA 25.8, Scotland 23. Fatal casualties NSDA 2.6, Scotland 1.7.
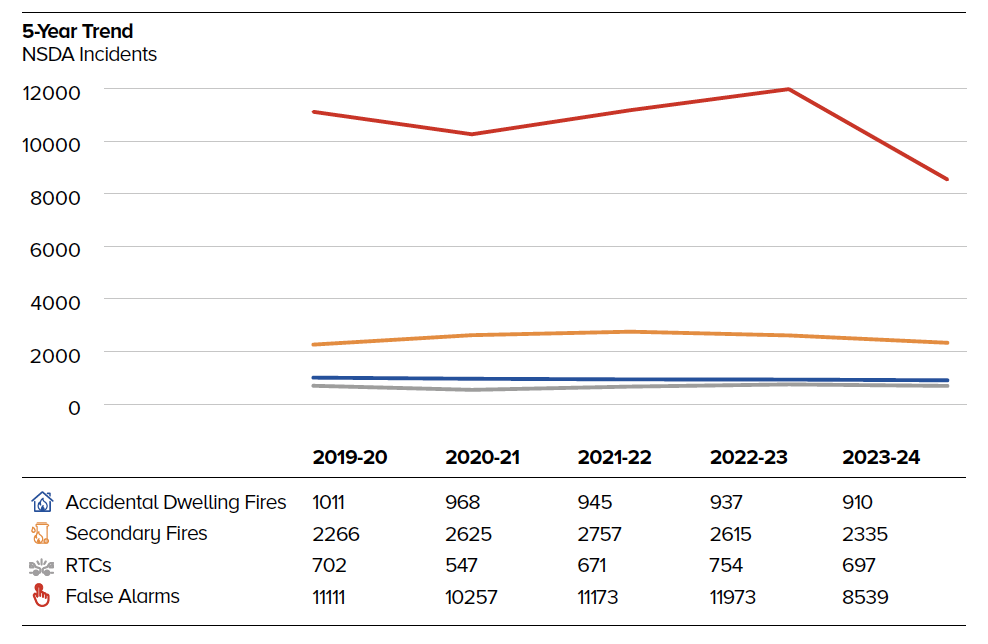
A 5-year trend line graph of North Service Delivery Area activity showing the numbers of accidental fires, secondary fires, road traffic collisions and false alarms.
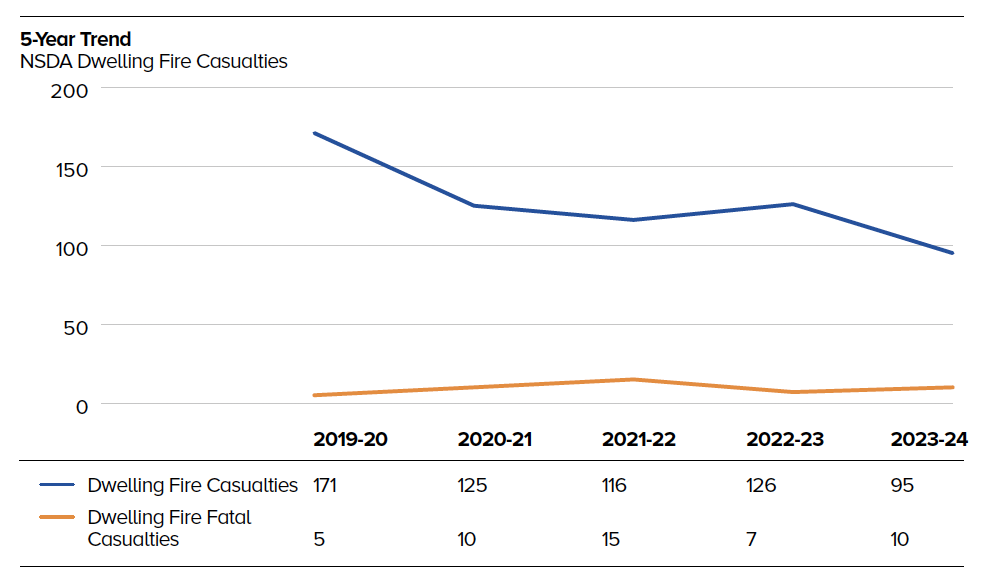
A 5-year trend line chart for dwelling fire casualties in the North Service Delivery Area for the years 2019-2024.
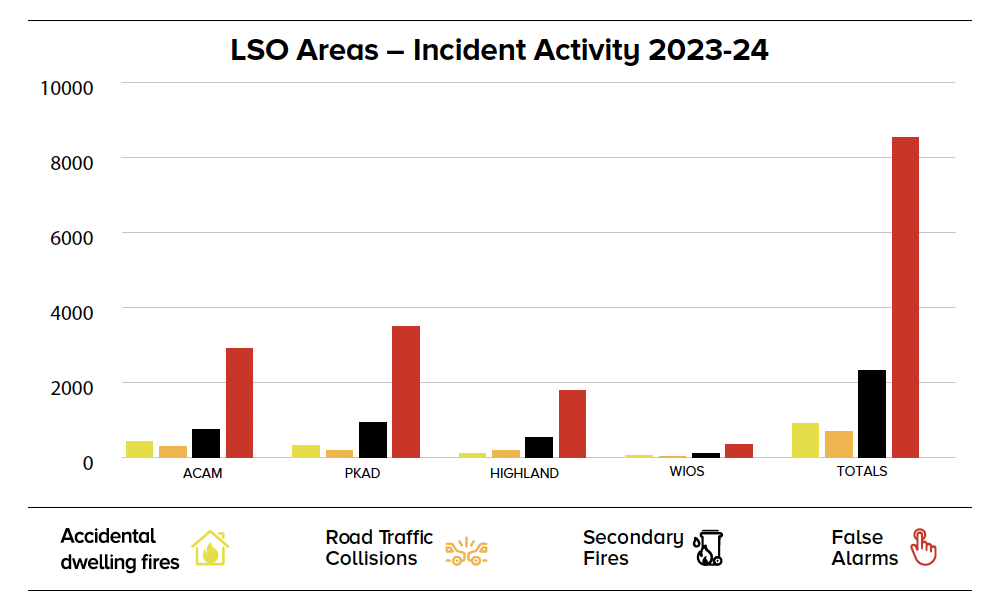
Bar chart comparing Local Senior Officer Areas activity for the year 2023-24. Comparison is made for accidental dwelling fires, road traffic collisions, secondary fires and false alarms.