HM Fire Service Inspectorate - local area inspection: City of Edinburgh
Related Downloads
2 About the area

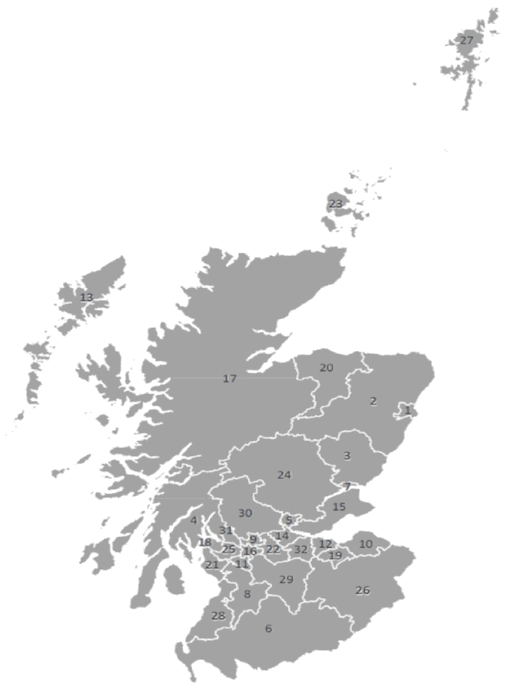
The City of Edinburgh is the area numbered 12 on the map in Figure 1. It covers an area of around 264 km2. It has a border with the local authority areas of East Lothian, Midlothian and West Lothian. In terms of the SFRS organisation structure, the City of Edinburgh is within the East SDA.
The City of Edinburgh is split into 17 council wards.
The population of the City of Edinburgh at the end of June 2018 was 518,500[1] making it the 2nd highest populated of the 32 local authority areas in Scotland. Around 9.5% of the Scottish population reside in the City of Edinburgh. The percentage of the population aged 65 and over, at 15.1%, is less than the overall percentage for Scotland of 18.9% in that age band.
There are various operational risks in the area, including, major roads, railways, airport, port and harbours, various commercial, industrial, military, and, as a UNESCO World Heritage Site, significant heritage risks.
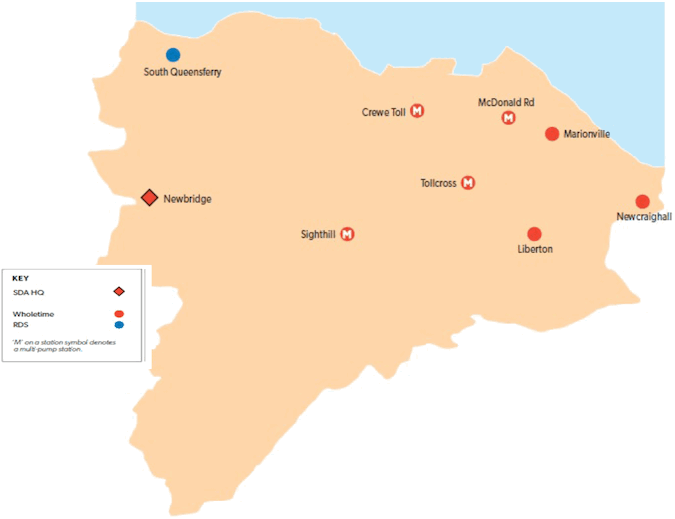
There are eight fire stations in the City of Edinburgh. The locations are shown in Figure 2. Table 1 shows the fire station duty system, the resources based there and incident activity.

| Fire station | Duty system ** | Appliances | Activity* 2018/19 |
|---|---|---|---|
| Crewe Toll | Wholetime | 2 rescue pumps 1 height appliance 1 prime mover |
2,459 |
| Liberton | Wholetime | 1 rescue pump 1 command support unit |
1,824 |
| Marionville | Wholetime | 1 rescue pump 1 water rescue |
1,575 |
| McDonald Road | Wholetime*** | 2 rescue pumps 1 height appliance 1 DIM vehicle |
3,258 |
| Newcraighall | Wholetime | 1 rescue pump 2 incident support units |
1,373 |
| Sighthill | Wholetime | 2 rescue pumps 1 heavy rescue |
1,950 |
| South Queensferry | RDS | 1 rescue pump | 138 |
| Tollcross | Wholetime | 2 rescue pumps 1 height appliance 1 BA Van |
4,579 |
*this is the number of times that an appliance from the fire station attended an incident – it is not an indication of the number of turnouts - the IRS data on which the activity totals are based exclude mobilisations which did not result in a direct incident attendance, for example, stand-by or where the appliance was turned back.
** wholetime crewed appliances are dual crewed with the exception of height appliances
*** although assigned to McDonald Road some vehicles are kept at other fire stations as a consequence of ongoing construction work
Employees[2]. The SFRS has 327 staff posts in the area, 26 (8%) of the staff identify themselves as female.
Incident statistics
Table 2 shows the number of incidents attended by the SFRS in the City of Edinburgh over a period of four years[3].
| Incident type | 2015/16 | 2016/17 | 2017/18 | 2018/19 |
|---|---|---|---|---|
| Primary fire | 1,224 | 1,171 | 1,045 | 989 |
| Secondary fire | 1,893 | 1,874 | 1,791 | 1,817 |
| Chimney fire | 8 | 8 | 5 | 7 |
| Road traffic collision | 143 | 145 | 137 | 105 |
| Other non-fire incident | 1,305 | 1,325 | 1,322 | 1,189 |
| False alarm (including non-fire false alarm) | 6,833 | 6,668 | 6,515 | 6,612 |
| Total incidents | 11,406 | 11,191 | 10,815 | 10,719 |
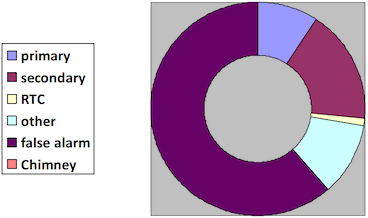
Figure 3 gives a visual reflection of the make-up of incidents within the City of Edinburgh for the most recent available statistics, 2018/19. Please note that the small number of chimney fires are not possible to represent on the chart.

Responding to false alarms represents almost 62% of all incidents attended by the SFRS in the City of Edinburgh in 2018/19. Unwanted fire alarm signals (UFAS) from non-domestic premises made up 4,013[4] of these false alarms and therefore comprise 37.4% of all incidents.
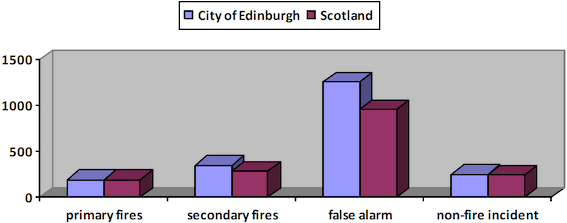
The incident rates for 2018/19 are shown in Figure 4 benchmarked against the rates for Scotland. In the City of Edinburgh the rates per population for primary fires are lower than for Scotland, however, the rate for secondary fires, false alarms and non-fire incidents are higher.

